Week 2 – Product-led Growth or Model-led Growth?

Last week was the first of a two part deep dive into insights around consumption business models. This week we continue with a brand new data insight. But first, a little bit of context for those not familiar with Zuora functionality.
As of the original publication date of this piece, Zuora Billing supports 11 core charge models. Users of Zuora Billing’s product catalog can mix and match any of these charge models within offerings that they build in the product catalog.
When an end customer signs up for one of those offerings and those charges are then invoiced, Zuora keeps all that data organized so that it’s relatively straightforward to report on how much billed revenue came from every charge model.
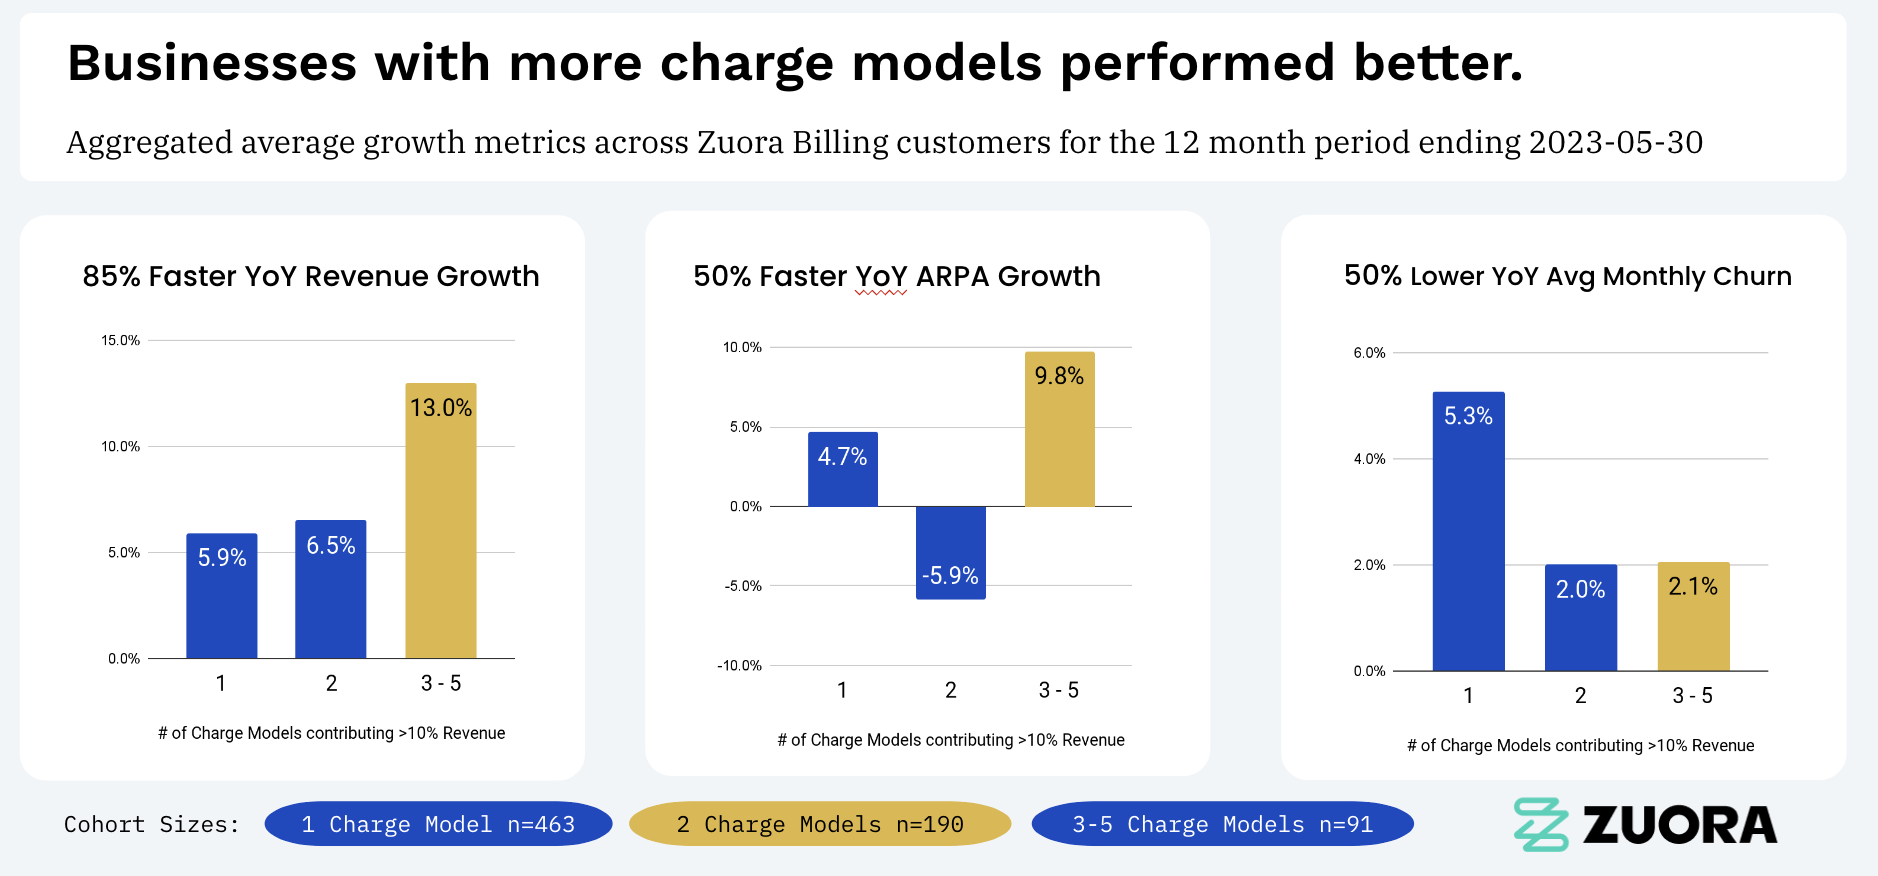
The insight this week is that those customers that had 3-5 charge models, where each charge model contributed at least 10% of total revenue, performed the best when it came to year-over-year revenue growth, average revenue per account (ARPA) growth, and average monthly churn rate.
Now, you might be asking yourself…what does this have to do with usage and consumption?
Well, at the Subscribed Institute, we talk to many Zuora customers with consumption models and pay very close attention to publicly traded consumption leaders. From these conversations and publicly available information, it’s our observation that nearly all these companies have the same two “macro” strategies in common. Those are:
- They leverage product-led growth to reduce barriers to onboard customers to their products.
- They orient their go-to-market motions around driving adoption and building trust so that customers eventually commit to upfront, recurring contracts.
To support these strategies, we think it’s also possible to generalize 3 core components that are common across all consumption business models. They are:
- Pay-as-you-Go
- “In arrears” usage models with no long-term commitment required from the customer. Generally, though not always, Pay-as-you-Go models are kept simple to facilitate “Product-led-Growth” (aka. PLG) customer acquisition strategies.
- Commitment
- “In advance” charge models that capture commitment in the form of recurring prepayments. Usually, these are similarly structured to the pay-as-you-go pricing but with volume discounts, tiered pricing, etc. to incentivize bigger commitments.
- Tracking
- “In arrears” models that track and bill based on logic tied to the amount committed to in a related prepayment.

At the end of the day, executing against these components means that a business must support parallel charge models in Zuora—at least 3 of them, specifically. Our finding this week shows that businesses that support such parallel models are the strongest performers.
Now, a valid critique of this approach might be to say that many of those customers in the 3-5 “bucket” could be supporting 3 different in-arrears usage models, or 3 different recurring models, etc. right?
And my response to that would be to call Goldilocks back in. Because she would say that the best performing businesses ALSO only had 25% of revenue coming from in-arrears usage models.
So, want to be like the best performers? Aim to support 3-5 charge models that generate not all, but most of your revenue from recurring prepayments. In other words… adopt a consumption business model.
Week 2 Methodology Details
Data in this analysis covered May 2021 – May 2023.
To control for data anomalies we did two things:
- Tenants of customers who went live after May 2019 were excluded. Therefore, all tenants had at least 2 years worth of data prior to the scope of the analysis.
- Outliers beyond the 25th and 75th percentiles were excluded to further normalize the data.
Applying these criteria, the study included Zuora Billing data from 744 businesses.
Revenue amounts were determined by totalling up the amount (converted to USD) of invoice items from posted invoices during the study period.
To determine cohorts, we counted how many unique charge models contributed at least 10% of a company’s 12-month invoiced revenue. As a hypothetical example, if a company in the study had 70% of their invoiced revenue coming from Flat Fee charge models, 20% of their invoiced revenue coming from per unit charge models, and 5% of their invoiced revenue coming from tiered charge models, this company would be bucketed into the “2 Charge Model” bucket in the charts above, since only 2 charge models are contributing more than 10% of billed revenue.
Written by:
Jonathan Brown, Sr. Customer Strategy Director


